Scenario Cases
Scenario 1: Business Data Analysis
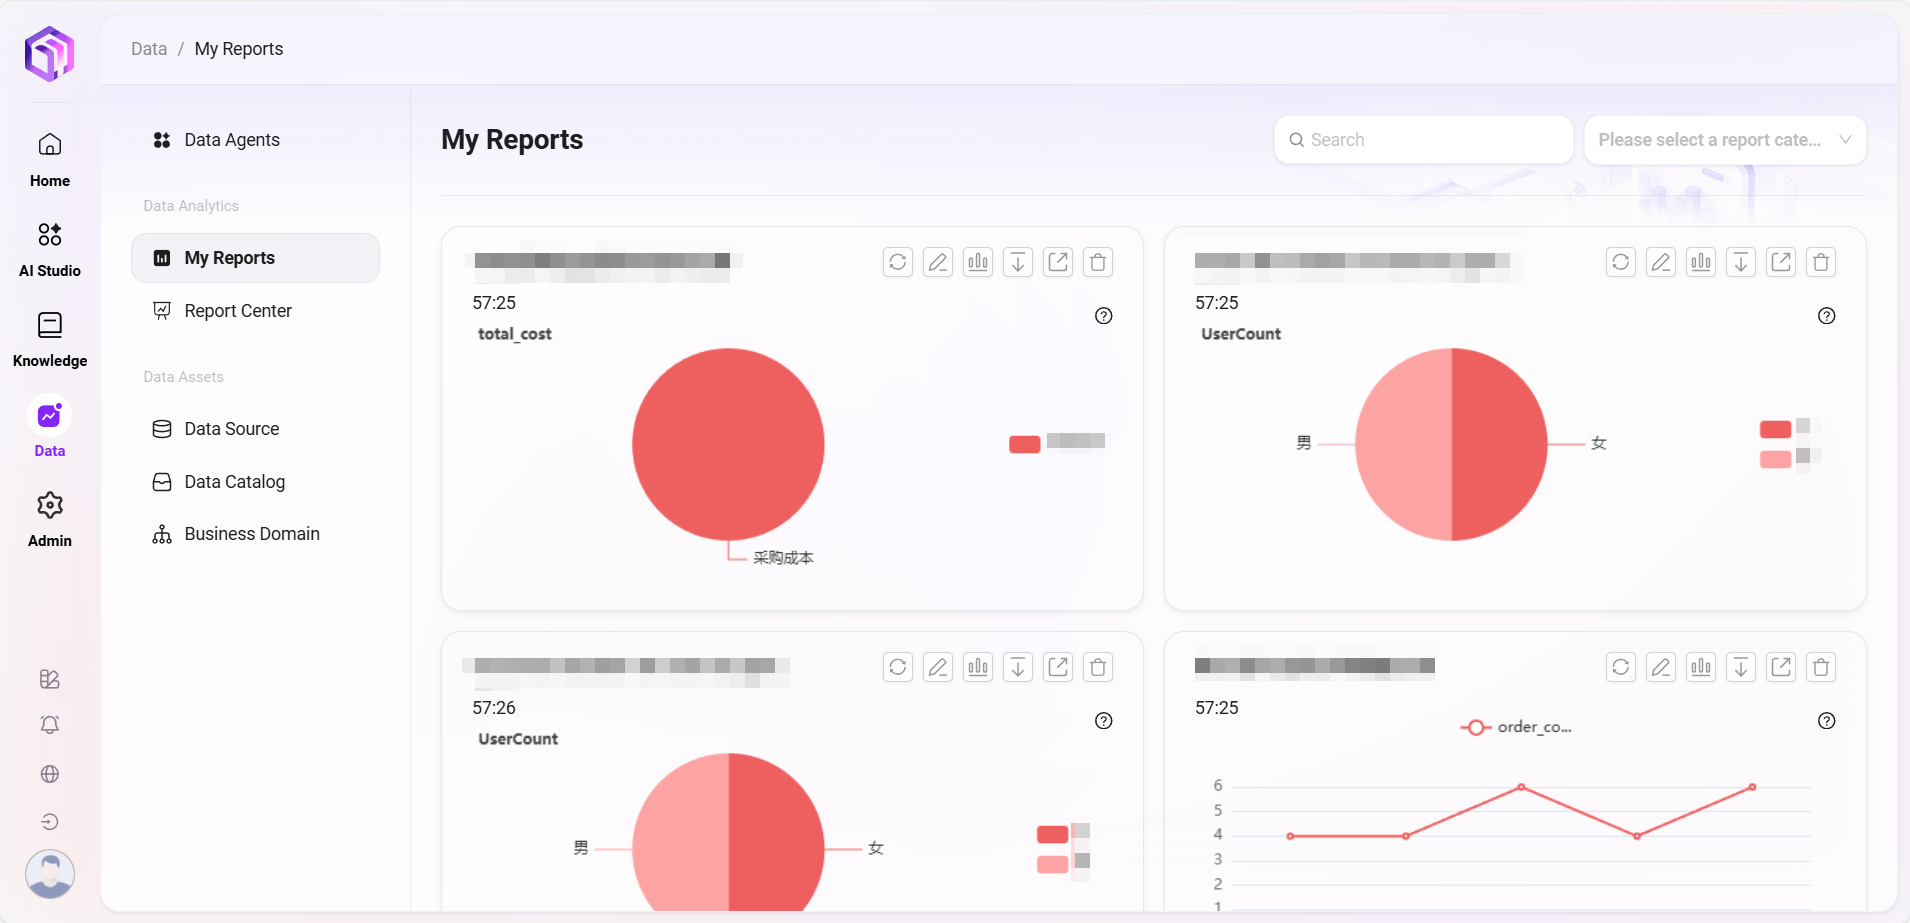
Typical Application: Integrate with business system data for intelligent analysis and insights
Function Description:
The system can connect with existing enterprise business systems to extract structured data, automatically analyze and present it through AI. Supported analysis types include but are not limited to:
- Product sales analysis
- Global sales comparison
- Financial-related statistical analysis (such as cost structure, profit trends, etc.)
Users can ask questions in natural language, such as:
- “Which product had the highest sales this month?”
- “How are the sales across different continents?”
- “What is the trend of expense proportion changes in the first half of 2025?”
Effect Improvement:
- Automatically generate charts, conclusions, and insights, saving analysis manpower;
- Flexible multi-dimensional data queries, supporting custom comparisons;
- Help business teams quickly identify problems and opportunities.
Suitable for sales, operations, finance, and other data-intensive departments.
Scenario 2: Ticket Data Analysis
Typical Application
In enterprise IT operations or customer support processes, a large amount of ticket data is often accumulated, covering various issue types, processing statuses, responders, and handling times. Traditional data analysis methods rely on manual aggregation and Excel statistics, which are not only inefficient but also difficult to handle massive data and multi-dimensional analysis needs.
Typical use cases include:
- Providing monthly/quarterly ticket handling analysis reports to customers or internal management;
- Identifying high-frequency fault types, recurring issues, and response bottlenecks;
- Analyzing different engineers' handling efficiency and workload distribution;
- Real-time monitoring of unresolved or overdue ticket trends;
- Quickly obtaining key indicators such as total tickets, completion rate, and closure cycle.
Function Description:
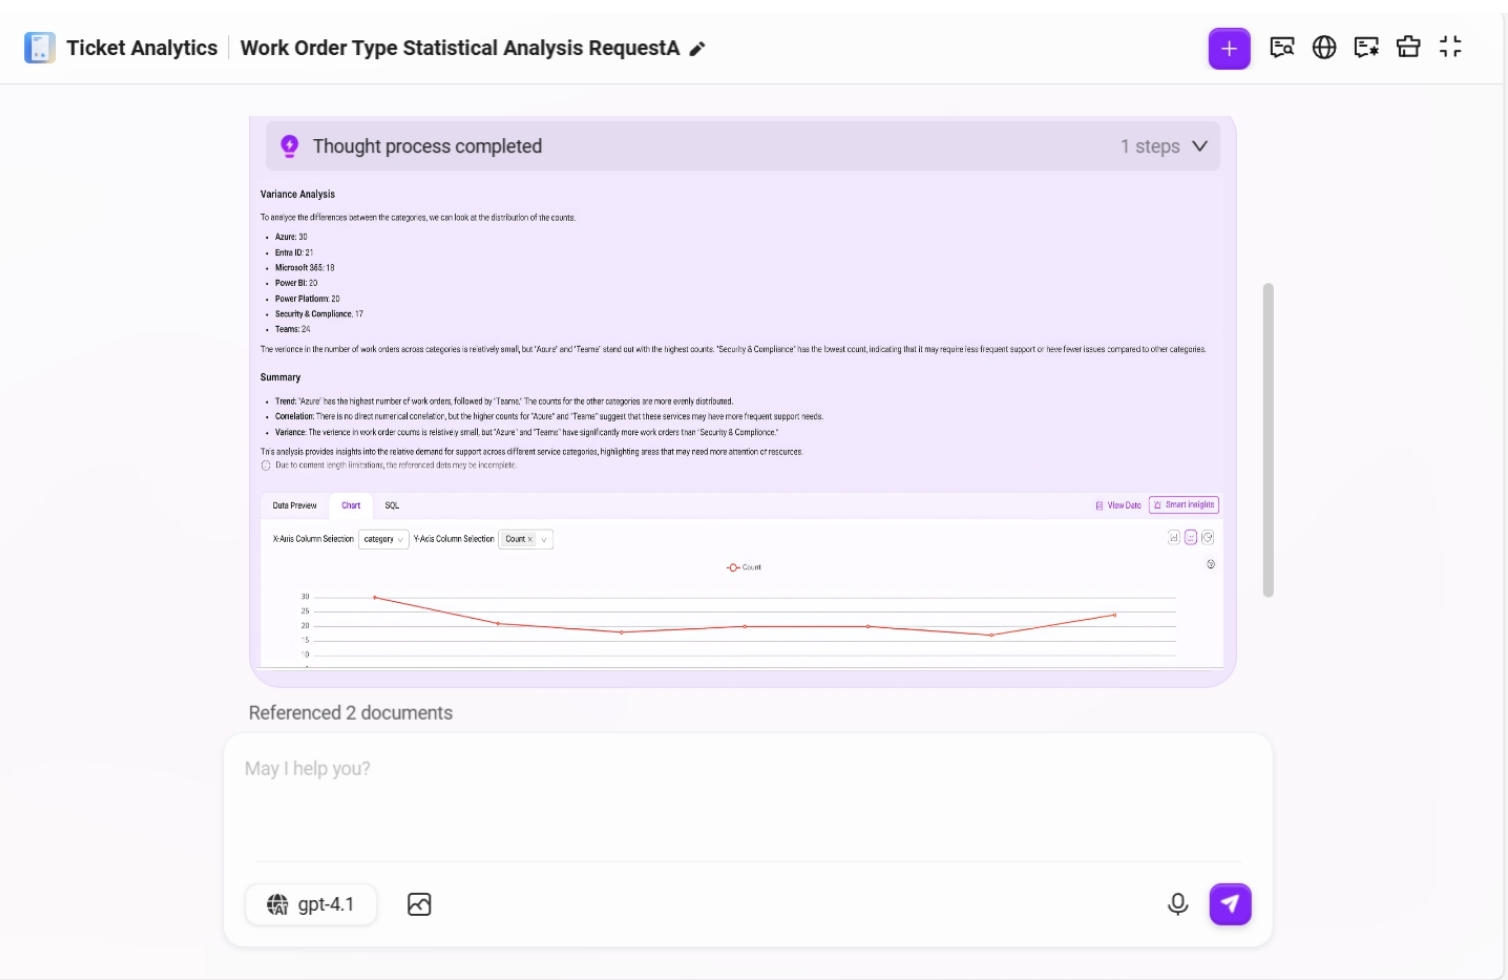
In this scenario, we build an intelligent agent based on data sources — "Ticket Analytics" — to achieve automatic aggregation, analysis, and visualization of ticket data, with the following core functions:
- Connect to database data sources: Access structured ticket data tables (e.g., support_logs), automatically read the latest data;
- Natural language analysis commands: Users can ask questions in natural language without mastering any data query syntax;
- Automatically generate statistical reports: Support generating statistical charts (bar charts, pie charts, line charts) by ticket type, status, time dimension, etc.;
- Customizable chart views: Charts support visual editing, allowing chart type changes and field dimension switching;
- Insights and trend analysis: Built-in intelligent insight functions automatically detect anomalies, trends, key changes, etc.;
- View underlying data and SQL: Support viewing detailed query results and underlying SQL, enhancing data transparency and analysis traceability.
Effect Improvement:
After deploying this ticket analysis assistant, compared with traditional manual statistics, significant improvements in efficiency and quality can be achieved:
| Comparison Item | Traditional Method | Ticket Analysis Assistant |
|---|---|---|
| Data Processing Efficiency | Manual operation, time-consuming | Automatic response, results returned within seconds |
| Multi-dimensional Statistics | Complex operation, prone to errors | Natural language queries, flexible multi-dimensional statistics |
| Visualization Display | Relies on manual charting, single style | Automatically generated charts, support flexible editing |
| Insight Capability | Based on experience, hard to discover potential patterns | Intelligent identification of trends, anomalies, and related issues |
| Report Generation | Multi-person collaboration, long cycle | One-click report generation, fast delivery to customers |
✅ The ticket analysis assistant greatly reduces the data processing threshold for operations engineers, improves the response speed and service quality of support teams, and is one of the important tools to enhance digital operation capabilities.